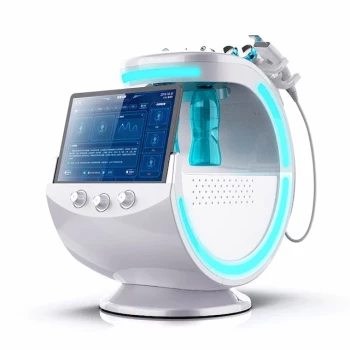
Professional 3D skin analysis systems objectively quantify aging by converting the skin surface into standardized, measurable topographic data. Optical profilometry, laser triangulation, and digital fringe projection create three-dimensional microrelief maps of defined skin areas. Algorithms then calculate parameters such as line density, anisotropy, wrinkle depth, wrinkle volume, and surface roughness, allowing clinicians to compare morphology over time rather than relying on visual judgment alone.
The central value of 3D skin analysis is repeatable measurement: it establishes a baseline, tracks specific structural changes, and documents whether treatment produces genuine smoothing or remodeling.
How 3D Systems Capture Skin Morphology
Creating a Three-Dimensional Surface Map
Professional systems project or detect structured light across the skin using methods such as fringe projection, optical surface profiling, or laser triangulation. The resulting data reconstructs the surface as a three-dimensional map rather than a conventional flat photograph.
This map represents the skin’s microrelief, including ridges, furrows, pores, fissures, and localized depressions. Measurements can then be taken from consistent anatomical regions.
Standardizing the Imaging Environment
Reliable longitudinal evaluation requires more than high-resolution imaging. Systems typically standardize the patient’s position, camera distance, angle, illumination, and field of view.
Frontal and 45-degree profile images can document facial morphology from repeatable perspectives. Controlled lighting is particularly important when evaluating fine lines, deep wrinkles, pigmentation, or erythema because ambient light can change their apparent severity.
Defining the Region of Interest
Clinicians analyze a defined region of interest, such as the forehead, glabella, crow’s-feet area, cheek, or hand. Restricting the analysis to the same anatomical area improves the comparability of baseline and follow-up measurements.
The system can then calculate metrics across that region instead of producing only a general visual impression of the entire face or hand.
Which Metrics Quantify Surface Aging?
Line Density and Anisotropy
Line density describes how many skin lines or grooves occur within a defined area. A change in density may indicate the formation, disappearance, or consolidation of surface lines.
The anisotropy index describes the directional organization of the skin’s microrelief. This helps distinguish an irregular surface from one dominated by lines running in a particular direction, which can be relevant when assessing structural reorganization or treatment-related smoothing.
Groove Depth and Depth Distribution
Wrinkle analysis can separate shallow epidermal lines from deeper grooves. The primary reference distinguishes approximately 0–20 micrometer epidermal lines from deeper dermal grooves.
This depth distribution is more informative than a single visual wrinkle grade because it indicates whether a change is limited to superficial microrelief or involves deeper structural depressions.
Average Wrinkle Depth
Average wrinkle depth, often represented as Wd, summarizes the depth of wrinkles within the selected region. It provides a direct numerical indicator for comparing baseline and post-treatment morphology.
Depth should be interpreted together with line width and density. A wrinkle may become shallower without disappearing, while a reduction in the number of lines may occur without a large change in the deepest groove.
Total Wrinkle Volume
Total wrinkle volume, often represented as Wv, estimates the three-dimensional space occupied by the grooves across the analyzed area. It incorporates more information than depth alone because it reflects the combined effect of wrinkle depth, width, and density.
This distinction matters clinically. Two regions can have similar maximum depths but substantially different total wrinkle burdens if one contains broader or more numerous grooves.
Surface Roughness
The arithmetic average roughness, or Ra, summarizes deviations from a reference surface across a measured profile or area. A lower Ra may indicate a smoother microrelief, although the result must be interpreted in relation to the measurement method and region analyzed.
Roughness is a general surface metric, whereas wrinkle-specific parameters identify the depth, density, and volume of particular grooves.
Related Optical and Morphometric Measures
Many professional systems also quantify pore count, texture ratio, spot count, lesion area, color depth, melanin density, and the a* index. The a* index is commonly used to characterize red-green color variation and can support assessment of erythema or inflammation.
Some advanced optical approaches evaluate epidermal architecture by establishing reference planes between the skin surface, granular layer, basal cell clusters, and dermal papillae. These measurements can help assess changes associated with photoaging or environmental damage, although not every commercial 3D analyzer measures histological layers directly.
How Systems Track Aging Progression
Establishing a Quantitative Baseline
The first examination records the initial state of the selected region. This may include wrinkle depth, total wrinkle volume, line density, roughness, pore characteristics, pigmentation, and color indices.
The baseline allows later results to be expressed as measured change rather than as a subjective statement that the skin “looks better” or “looks older.”
Comparing Serial Measurements
At follow-up, the system repeats the same imaging and analysis process. Clinicians can compare absolute values, percentage changes, depth distributions, and three-dimensional maps.
Patterns such as microrelief smoothing, line thinning, reduced groove depth, or structural restructuring provide evidence of morphological change. Stable imaging conditions are essential because differences in expression, lighting, hydration, or positioning can otherwise resemble biological change.
Distinguishing Superficial and Deeper Change
A treatment may improve superficial epidermal lines while leaving deeper dermal grooves largely unchanged. Depth distribution profiles help separate these outcomes.
This distinction prevents an apparent improvement in fine texture from being incorrectly interpreted as complete correction of deeper wrinkles.
Evaluating Location-Specific Aging
Aging does not progress uniformly across the face. Wrinkle development can differ by anatomical location, with forehead lines and crow’s feet becoming pronounced at different stages from glabellar lines.
Regional analysis therefore supports a more precise aging profile than a single overall facial score. It can also help clinicians select treatment parameters for localized features when using energy-based interventions such as HIFU or fractional CO2 laser systems.
Documenting Treatment Efficacy
Objective measurements support before-and-after evaluation for procedures involving laser, radiofrequency, energy-based devices, or hydration-focused treatments. A reduction in wrinkle depth, wrinkle volume, or roughness can be documented alongside standardized images.
The strongest assessment combines numerical results, three-dimensional maps, and controlled visual documentation. No single metric fully represents skin aging.
Why Objective Measurement Matters Clinically
Reducing Observer Bias
Traditional assessment depends heavily on lighting, viewing angle, evaluator experience, and subjective categories such as “fine” or “deep.” Quantitative analysis reduces the influence of these factors by applying defined algorithms to standardized data.
Independent evaluators can review the same image sets and measurements, improving consistency in clinical documentation and research.
Translating Appearance Into Structure
Patients and clinicians may perceive “aging” as a general visual impression. Three-dimensional analysis translates that impression into specific structural variables, such as increased line density, deeper grooves, or greater wrinkle volume.
This makes treatment progress easier to evaluate and supports clearer follow-up discussions.
Supporting Protocol Design
Localized depth and volume measurements can inform the selection and adjustment of treatment strategies. A region dominated by superficial lines may require a different approach from one characterized by broad, deep grooves.
The measurements support clinical judgment; they do not replace diagnosis, treatment planning, or assessment of patient-specific risks.
Understanding the Trade-offs
Measurement Is Only as Reliable as Standardization
A high-resolution system cannot correct inconsistent acquisition. Changes in facial expression, hydration, head position, camera angle, focus, or lighting can affect the result.
Longitudinal protocols should use the same device, anatomical region, patient positioning, imaging conditions, and analysis settings whenever possible.
Numerical Precision Does Not Guarantee Clinical Relevance
A system may report small numerical differences that are statistically detectable but not meaningful to the patient or clinically important. Conversely, a visible improvement may not be captured by one metric.
Interpretation should consider measurement variability, multiple parameters, standardized photographs, and clinical context.
Different Systems Are Not Automatically Interchangeable
Metrics generated by different devices may use different optical methods, reference planes, algorithms, and definitions of a wrinkle or pore. Values from one platform should therefore not be assumed to be directly comparable with values from another.
For reliable monitoring, clinics should maintain device-specific protocols and avoid treating proprietary scores as universal biological standards.
Surface Analysis Does Not Equal Direct Dermal Histology
A surface map measures external morphology. It can suggest structural change and quantify visible topography, but it does not directly prove changes in collagen, elastin, or deeper tissue architecture.
Claims about dermal remodeling should remain proportionate to what the measurement actually captures.
Aging Progression Is Multifactorial
Wrinkle morphology is influenced by intrinsic aging, ultraviolet exposure, repeated facial movement, hydration, inflammation, and environmental damage. A change in surface metrics should be interpreted as evidence of morphological change, not automatically assigned to one biological cause.
Making the Right Choice for Your Goal
A professional evaluation should combine standardized acquisition, region-specific analysis, and serial measurements interpreted within a consistent clinical protocol.
- If your primary focus is treatment efficacy: Track the same region with wrinkle depth, total wrinkle volume, line density, roughness, and standardized three-dimensional maps before and after treatment.
- If your primary focus is aging progression: Establish repeatable longitudinal imaging and monitor depth distribution, anisotropy, line density, and location-specific changes over time.
- If your primary focus is superficial texture: Emphasize shallow-line distribution, Ra, pore characteristics, and texture ratio while separating these findings from deeper grooves.
- If your primary focus is energy-based treatment planning: Use regional wrinkle depth and volume to characterize the treated area, then combine those measurements with clinical assessment before selecting parameters.
- If your primary focus is research or impartial grading: Control lighting, position, camera angle, region of interest, and analysis settings, and document the device and algorithm used for every measurement.
Objective 3D analysis turns visible skin aging into repeatable structural evidence that clinicians can measure, compare, and interpret responsibly.
Summary Table:
| Metric | Description | Clinical Relevance |
|---|---|---|
| Line Density | Number of lines per unit area | Indicates wrinkle formation or smoothing |
| Anisotropy Index | Directional organization of microrelief | Assesses structural reorganization |
| Groove Depth Distribution | Depth of epidermal vs. dermal lines | Separates superficial from deep changes |
| Average Wrinkle Depth | Mean depth of wrinkles in region | Direct numerical indicator for comparison |
| Total Wrinkle Volume | Combined 3D space of grooves | Reflects overall wrinkle burden |
| Surface Roughness (Ra) | Arithmetic roughness of skin surface | General smoothness metric |
| Pore Count & Texture Ratio | Pore density and surface texture | Evaluates skin texture quality |
| a* Index | Red-green color variation | Helps assess erythema or inflammation |
Elevate your clinic's skin analysis with BELIS's advanced aesthetic devices. Our professional-grade systems, including 3D skin analyzers, integrate precision and innovation to enhance patient outcomes. Partner with us to access cutting-edge technology and comprehensive support. Contact us today to explore how BELIS can elevate your practice.
Related Products
- Skin Tester Analysis Machine Analyser for Skin Testing
- Skin Tester Analysis Machine Analyser for Skin Testing
- Hydrofacial Machine with Facial Skin Analyzer and Skin Tester
- Hydrafacial Machine with Facial Skin Analyzer Skin Tester
People Also Ask
- What is the necessity of using professional skin analyzers? Transform Clinic Consultations with Scientific Diagnostics
- Why is pre-treatment diagnostic skin assessment critical before performing periocular aesthetic procedures, and how do professional skin testing devices assist in treatment protocol selection? Boost Safety & Results
- How does acne pathogenesis inform the use of diagnostic skin testing devices in medical aesthetic clinics? Unlock Precision in Acne Care
- How do pixel array detectors improve the efficiency of optical spectrum measurement in skin analyzers? Faster, simultaneous capture
- How do professional skin testers and Wood's lamps support clinical decisions before laser procedures? Key insights for safe and effective treatment planning