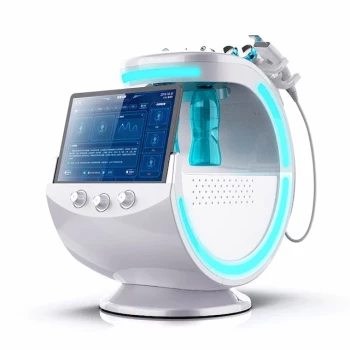
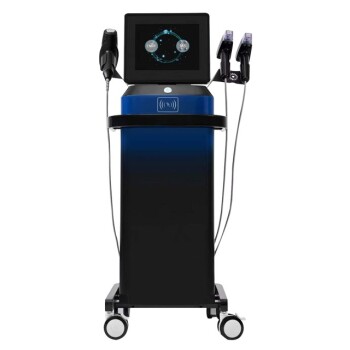
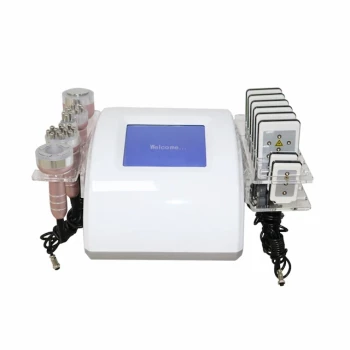
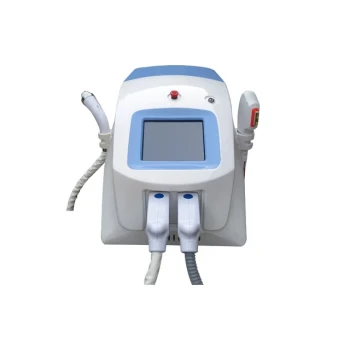
3D morphological tree analysis provides objective evidence of which skin-depth structures a treatment is affecting. By classifying cutaneous lines into depth families, such as 0–10 µm, 10–20 µm, and deeper than 20 µm, professional skin testing equipment can distinguish superficial microrelief changes from deeper dermal restructuring. This helps clinicians evaluate whether a procedure is producing the intended depth-specific response instead of relying only on visual inspection.
The clinical value lies in linking measurable surface morphology with treatment response. A higher density of fine superficial lines combined with fewer deeper grooves may indicate improved dermal organization and microrelief, although the analysis should be interpreted as indirect morphological evidence rather than a direct histological measurement of penetration depth.
Why Treatment Depth Matters
Different depths reflect different structures
Skin lines are not uniform. Shallow lines primarily describe fine epidermal surface texture, while deeper grooves reflect more pronounced structural changes in the skin’s relief.
A 3D morphological tree organizes these features into depth-based families. This gives clinicians a more detailed view of whether treatment effects are concentrated near the surface or associated with deeper remodeling.
Visual inspection cannot resolve depth reliably
Manual observation can identify broad changes such as smoother-looking skin, but it cannot consistently determine which depth ranges have changed.
Three-dimensional quantitative analysis adds measurable information about line density, depth distribution, surface roughness, and directional organization. This reduces dependence on lighting conditions, examiner experience, and subjective interpretation.
How 3D Morphological Tree Analysis Works
It converts skin relief into depth families
The system analyzes the skin’s microtopography and separates lines according to their measured depth. Typical categories may include 0–10 µm, 10–20 µm, and greater than 20 µm.
This creates a depth distribution profile that can be compared before treatment, after treatment, and during follow-up visits.
It shows morphology in three dimensions
A three-dimensional representation captures both the shape and spatial arrangement of skin lines. This can reveal changes that are difficult to appreciate in a flat image, including line thinning, microrelief smoothing, and altered orientation.
The analysis can also incorporate related measurements such as arithmetic average roughness (Ra), line density, and anisotropy.
It supports quantitative longitudinal assessment
Repeating the measurement over time allows clinicians to track whether a morphological change is temporary, progressive, or sustained.
This is particularly useful for evaluating energy-based aesthetic procedures, topical or injectable products, and treatment protocols intended to improve skin texture or structural organization.
What the Depth Pattern Can Indicate
Increased superficial line density
An increase in fine lines within the 0–20 µm range, particularly when accompanied by reduced deeper grooves, may indicate a more refined and evenly distributed microrelief.
In the context of the primary reference, this pattern is associated with dermal restructuring and improved multidirectional elasticity related to collagen organization.
Reduced deeper-line density
A reduction in lines deeper than 20 µm suggests that prominent grooves or deeper surface irregularities have become less pronounced.
This may support a conclusion of improved structural appearance, but it should not be treated as proof that collagen remodeling occurred at a specific anatomical depth without corroborating evidence.
Changes in roughness and anisotropy
A reduction in roughness can support an assessment of surface smoothing. Changes in anisotropy may indicate that the orientation of skin lines has become more or less organized.
These measures provide context for the depth-family results and help distinguish a general reduction in roughness from a broader change in skin architecture.
How It Improves Clinical Decision-Making
It helps verify whether the treatment reached its intended target
Treatment parameters are often selected to affect a particular tissue layer or structural feature. Depth-distribution data can show whether the observed response is consistent with that intended target.
If the change is limited to superficial lines when deeper restructuring was expected, the clinician may need to reassess the protocol, treatment intensity, interval, or patient response.
It supports individualized parameter selection
Professional analyzers can be used before treatment to characterize baseline texture and skin condition. Combined with measurements of erythema, melanin, water content, sebum distribution, and inflammation, this information can help clinicians evaluate tolerance and adjust treatment settings.
The result is a more evidence-based approach to selecting and refining treatment parameters.
It provides objective treatment evidence
Before-and-after images alone can be affected by camera angle, lighting, hydration, and expression. Quantitative 3D measurements provide a more consistent basis for documenting response.
This supports clinical evaluation, patient communication, quality assurance, and comparison of different treatment protocols.
It links structural findings with recovery monitoring
Post-procedure measurements can be used alongside barrier-repair indicators and inflammation-related parameters. This helps clinicians distinguish intended textural improvement from temporary irritation or incomplete recovery.
The equipment therefore contributes to both efficacy assessment and follow-up care.
Understanding the Trade-offs
Morphological depth is not the same as histological depth
A 3D morphological tree measures the geometry of the visible or optically detected skin surface. It does not necessarily prove the exact depth at which a device delivered energy or where biological remodeling occurred inside the tissue.
Depth-related findings should therefore be described as morphological evidence of treatment response, not as a substitute for biopsy, imaging validation, or other direct tissue assessment.
Results depend on device validation
Different systems may use different optical methods, algorithms, thresholds, and definitions for line depth. A result reported as a particular micrometer range is meaningful only when the device has been properly calibrated and its measurement method is understood.
Clinics should use the same validated system and acquisition protocol when comparing measurements over time.
Biological variability can affect interpretation
Hydration, inflammation, sebum, lighting, facial movement, and temporary barrier disruption can alter skin appearance and measured texture.
Depth-family data should be interpreted together with clinical findings and complementary metrics such as a* values for erythema, melanin density, water content, and roughness.
More data does not automatically mean better decisions
A large number of measurements can create false precision if there is no defined clinical endpoint. The most useful approach is to select parameters that correspond to the treatment objective and evaluate them consistently.
Making the Right Choice for Your Goal
Use 3D morphological tree analysis as one component of a validated clinical assessment protocol.
- If your primary focus is assessing treatment depth: Compare the distribution of superficial and deeper line families before and after treatment, while treating the results as indirect morphological evidence rather than direct histological proof.
- If your primary focus is documenting efficacy: Track line density, depth distribution, roughness, and three-dimensional microrelief over standardized follow-up intervals.
- If your primary focus is treatment personalization: Combine baseline morphological data with erythema, melanin, hydration, sebum, and inflammation measurements to guide parameter selection and tolerance assessment.
- If your primary focus is patient safety and recovery: Use post-procedure measurements to monitor barrier repair and distinguish expected remodeling from persistent inflammation or irritation.
Used with standardized acquisition, complementary measurements, and appropriate clinical judgment, 3D morphological tree analysis turns treatment depth from a visual assumption into a measurable, evidence-informed assessment.
Summary Table:
| Depth Category | Clinical Significance | Typical Interpretation |
|---|---|---|
| 0–10 µm | Superficial microrelief, fine epidermal texture | Improved surface smoothness, possible early response |
| 10–20 µm | Intermediate structures, dermal-epidermal junction | Refined microrelief, improved dermal organization |
| >20 µm | Deeper grooves, pronounced structural changes | Reduced prominence, potential deeper remodeling |
| Roughness (Ra) | Overall surface irregularity | Decrease indicates smoother skin |
| Anisotropy | Directional organization of lines | Changes indicate altered skin architecture |
Enhance your practice with BELIS's professional skin testing devices, featuring advanced 3D morphological tree analysis for objective, depth-based treatment assessment. Our portfolio includes cutting-edge systems for aesthetic clinics and premium salons, ensuring precise, evidence-based care. Contact us today to elevate your treatment outcomes and patient satisfaction. Get in touch with our experts to learn more about integrating these advanced diagnostic tools into your workflow.
Related Products
- Skin Tester Analysis Machine Analyser for Skin Testing
- Skin Tester Analysis Machine Analyser for Skin Testing
- Hydrafacial Machine with Facial Skin Analyzer Skin Tester
- Hydrofacial Machine with Facial Skin Analyzer and Skin Tester
- RF Microneedling Machine Micro Needle Radio Frequency Machine
People Also Ask
- What is the necessity of using professional skin analyzers? Transform Clinic Consultations with Scientific Diagnostics
- How does acne pathogenesis inform the use of diagnostic skin testing devices in medical aesthetic clinics? Unlock Precision in Acne Care
- How do pixel array detectors improve the efficiency of optical spectrum measurement in skin analyzers? Faster, simultaneous capture
- How do professional skin testers and Wood's lamps support clinical decisions before laser procedures? Key insights for safe and effective treatment planning
- Why is the double integrating sphere technique with inverse Monte Carlo simulation used to measure skin optical properties for aesthetic laser and skin analyzer development?