Skin line anisotropy provides a measurable signal of how orderly or directionally constrained the skin surface has become. Advanced skin analysis systems map fine-line orientations into a compass rose distribution, then calculate an Anisotropy Index (AI) that reflects the concentration of lines along particular angles. Higher directional concentration is commonly associated with dry or photoaged skin, while younger or well-hydrated skin tends to show a more uniform, multidirectional pattern. Comparing AI alongside wrinkle depth, line density, and elasticity measurements enables a more objective evaluation of aging and treatment response.
The key insight: A changing AI can reveal structural changes in the skin line network that may not yet be obvious visually, but it must be interpreted with standardized imaging, anatomical consistency, hydration control, and complementary aging metrics.
How Skin Line Anisotropy Is Measured
Mapping the skin line network
A high-resolution imaging system captures the skin surface and identifies the orientation of visible lines, grooves, or microrelief features. Each detected line is assigned an angle, creating a directional distribution that can be displayed as a compass rose.
A uniform distribution indicates that lines extend across many directions with relatively similar frequency. A concentrated distribution indicates that lines are preferentially aligned along one or more dominant angles.
Converting orientation into an Anisotropy Index
The system summarizes the angular distribution as an Anisotropy Index. The precise mathematical definition can vary by device, so results should be compared using the same instrument, software version, region of interest, and processing settings.
In practical terms, a higher AI means greater directional organization or alignment. A lower AI indicates a more isotropic surface, where line orientations are distributed more evenly.
Separating anisotropy from simple line quantity
Anisotropy does not measure how many lines exist by itself. Two areas can have similar line density but different AI values if the lines in one area are strongly aligned and the lines in the other are distributed in multiple directions.
This distinction matters because aging can involve both more pronounced lines and reorganization of the line network. AI therefore adds structural information that wrinkle counts alone cannot provide.
What Anisotropy Reveals About Skin Aging
Detecting directional organization associated with aging
Dryness and photoaging can produce a more directionally concentrated skin texture. In these circumstances, the compass rose may show stronger peaks, corresponding to a higher AI.
This pattern can serve as a quantitative indicator of surface reorganization. It should be treated as an aging-related signal rather than a standalone diagnosis, because hydration, facial movement, anatomical location, and image quality can also alter line orientation.
Monitoring changes before visible wrinkle progression
Microscopic changes in line organization may occur before a person notices a clear difference in the mirror. Tracking AI over time can therefore identify early changes in surface structure or a response to treatment that is not yet reflected in obvious wrinkle grading.
The strongest interpretation comes from combining AI with wrinkle depth, line density, depth distribution, and elasticity. A single metric cannot represent the full biological process of skin aging.
Distinguishing shallow texture from deeper grooves
Three-dimensional systems can separate shallow epidermal lines from deeper dermal grooves using microtopography and optical profilometry. This allows clinicians to determine whether a change in AI reflects superficial texture smoothing, deeper structural remodeling, or a shift in the relative prominence of different line types.
For example, a treatment may reduce shallow line visibility without substantially changing deep wrinkle volume. AI may improve in that case, but the result should be reported alongside depth-specific measurements.
Evaluating Treatment Efficacy Objectively
Establishing a standardized baseline
Before treatment, the system should record the AI and related measurements for a defined anatomical region. Standardized facial positioning, lighting, camera distance, focus, and image acquisition conditions are essential for making later measurements comparable.
Baseline documentation can also include front and side photographs, three-dimensional topography, average wrinkle depth, total wrinkle volume, elasticity parameters, and pigment or barrier indicators where relevant.
Measuring post-treatment reorganization
After treatment, the same region is imaged using the same protocol. A meaningful reduction in AI may indicate that previously concentrated lines have become less directionally dominant, consistent with a more uniform skin surface.
The interpretation depends on the treatment timeline. Hydrating formulations may produce relatively rapid changes in surface texture, whereas energy-based procedures or injectable treatments may require longer follow-up to assess remodeling of deeper structures.
Combining AI with wrinkle and elasticity data
AI is most useful as part of a multidimensional response profile. A favorable treatment response might include:
- Reduced AI, indicating less directional concentration.
- Lower shallow-line density or reduced line depth.
- Lower average wrinkle depth or total wrinkle volume.
- Improved elasticity measurements, such as a change in a device-specific elasticity ratio.
- More uniform three-dimensional microrelief.
These measurements help distinguish an actual structural response from temporary visual improvement caused by lighting, makeup, transient swelling, or surface hydration.
Supporting personalized treatment planning
Regional measurements can show that aging is not uniform across the face. Forehead lines, crow’s feet, glabellar lines, and areas of sagging may have different depth, density, and orientation patterns.
Clinicians can use these localized profiles to select treatment parameters and combinations more precisely. The data can also establish whether a procedure improved surface organization, deeper wrinkle morphology, elasticity, or only the visual appearance of a particular region.
Designing a Reliable Measurement Protocol
Keep the region of interest consistent
AI should be measured in the same anatomical area at each visit. Small changes in placement can produce large differences because line orientation varies naturally between facial regions.
Automated or carefully documented region-of-interest selection improves repeatability. Results should be recorded separately for clinically meaningful areas rather than averaged across the entire face when regional differences are important.
Control hydration and short-term skin conditions
Hydration can change the visibility and apparent geometry of superficial lines. Cleansing, recent product application, sweating, swelling, and environmental conditions can also affect the captured pattern.
A consistent acclimatization period and standardized pre-imaging routine reduce these sources of variation. Hydration-related changes should not automatically be interpreted as long-term dermal remodeling.
Use repeatable imaging conditions
Standardized lighting and positioning are necessary for reliable longitudinal comparisons. Three-dimensional systems should also maintain consistent calibration, capture angle, spatial resolution, and reconstruction settings.
Quality control should identify motion artifacts, shadows, glare, insufficient focus, and incomplete line detection before AI values are accepted for clinical interpretation.
Use repeated measurements where precision matters
Small changes in AI may reflect measurement variability rather than treatment effect. Repeated captures or replicate analyses can help establish the system's short-term variability for a given region and protocol.
Treatment claims should be based on changes that exceed expected technical and biological variation, rather than on a single before-and-after image.
Understanding the Trade-offs
AI is not a direct measure of biological age
A high AI does not prove that skin is older, and a low AI does not prove that skin is biologically younger. Skin type, dryness, facial expression, anatomical site, sun exposure, and image-processing choices can all influence directional line patterns.
AI is best described as a quantitative skin surface descriptor that contributes to aging assessment. It becomes more clinically meaningful when interpreted with other validated measurements.
Directional change can have multiple causes
A reduction in AI may reflect improved hydration, temporary swelling, surface filling, altered lighting, or true microrelief remodeling. These explanations can produce similar visual outcomes but have different clinical implications.
Depth profiles, wrinkle volume, elasticity data, and appropriately timed follow-up help determine whether the change is superficial, structural, or transient.
Device-specific indices may not be interchangeable
Different systems may use different line-detection algorithms, angular bin sizes, normalization methods, and AI definitions. An AI value from one device should not automatically be compared with a value from another.
For longitudinal monitoring, the same device and analysis pipeline should be maintained whenever possible. Cross-device comparisons require technical validation or calibration.
Highly precise data still requires clinical context
Automated analysis improves objectivity, but it does not replace clinical examination or patient-reported outcomes. A numerically improved skin texture may not correspond to the patient's primary concern, such as laxity, pigmentation, discomfort, or facial expression lines.
The most defensible evaluation combines instrument data with standardized visual assessment and a clearly defined treatment objective.
Making the Right Choice for Your Goal
Use anisotropy as one component of a structured, repeatable measurement strategy.
- If your primary focus is evaluating skin aging: Track AI together with line density, shallow and deep wrinkle profiles, wrinkle depth, wrinkle volume, and elasticity to distinguish surface reorganization from broader structural aging.
- If your primary focus is measuring cosmetic formulation efficacy: Standardize hydration, imaging conditions, and follow-up timing, then assess whether AI changes alongside microrelief smoothing and line thinning.
- If your primary focus is assessing energy-based or injectable treatment: Establish regional three-dimensional and elasticity baselines, then use post-treatment AI, wrinkle volume, and depth measurements to evaluate both superficial and deeper effects.
- If your primary focus is research or clinical validation: Define the AI calculation method, region of interest, acquisition protocol, repeatability limits, and clinically meaningful change before collecting outcome data.
When standardized and interpreted with complementary metrics, skin line anisotropy turns subtle surface reorganization into objective evidence that can guide both aging assessment and treatment decisions.
Summary Table:
| Metric | What It Measures | Relevance to Aging | Clinical Use |
|---|---|---|---|
| Anisotropy Index (AI) | Directional concentration of skin lines | Higher AI indicates more aligned lines, often seen in photoaged/dry skin | Monitor changes in AI to assess treatment impact on skin surface organization |
| Line Density | Number of visible skin lines | Aging may increase line density | Track changes in line density to evaluate anti-aging treatments |
| Wrinkle Depth | Depth of wrinkles (shallow vs. deep) | Deeper wrinkles are a sign of structural aging | Measure depth to distinguish superficial vs. deep remodeling |
| Elasticity | Skin's ability to snap back | Reduced elasticity is a hallmark of aging | Combine with AI to assess structural changes |
Key Takeaway: AI adds unique structural information but should be interpreted with other metrics for a complete assessment.
Elevate your skin analysis capabilities with BELIS’s advanced imaging systems. Our precision devices integrate anisotropy metrics, 3D topography, and elasticity measurements to provide comprehensive, objective assessments for your clinic. Whether you're evaluating treatment efficacy or tailoring personalized plans, BELIS's professional-grade equipment helps you deliver superior results. Contact our experts today to discover how our solutions can transform your practice. Get in touch with us now to schedule a demo and see the difference advanced analytics can make.
Related Products
- Skin Tester Analysis Machine Analyser for Skin Testing
- Skin Tester Analysis Machine Analyser for Skin Testing
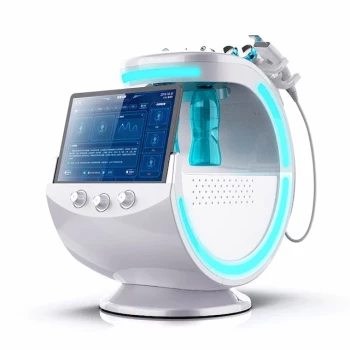
- Hydrofacial Machine with Facial Skin Analyzer and Skin Tester
- Hydrafacial Machine with Facial Skin Analyzer Skin Tester
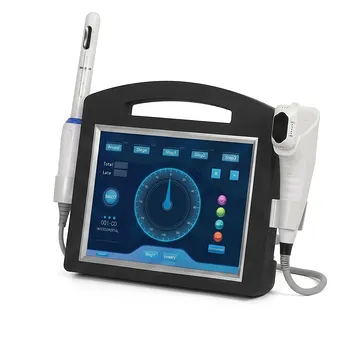
- 4D 12D HIFU Machine Device for Skin Tightening
People Also Ask
- How does assessing pigment depth with advanced skin analysis devices impact laser parameter selection and patient outcomes in hyperpigmentation treatment? Optimize Laser Therapy Results
- What role do skin analysis and detection devices play in customized treatment? Enhance Precision and Patient Outcomes
- What role do skin testing and analysis devices play in managing patient expectations prior to laser and resurfacing procedures? Learn how objective data improves consultations and outcomes.
- How do skin testing and analysis devices assist in evaluating the effectiveness of fractional laser treatments?
- How can diagnostic evaluation frameworks and skin analysis devices be used to guide parameter selection for facial resurfacing procedures? Unlock Personalized Treatment Planning